


DublinCity
DublinCity: Annotated LiDAR Point Cloud and its Applications
Iman Zolanvari, Susana Ruano, Aakanksha Rana, Alan Cummins, Rogerio Eduardo da Silva, Morteza Rahbar, Aljosa Smolic
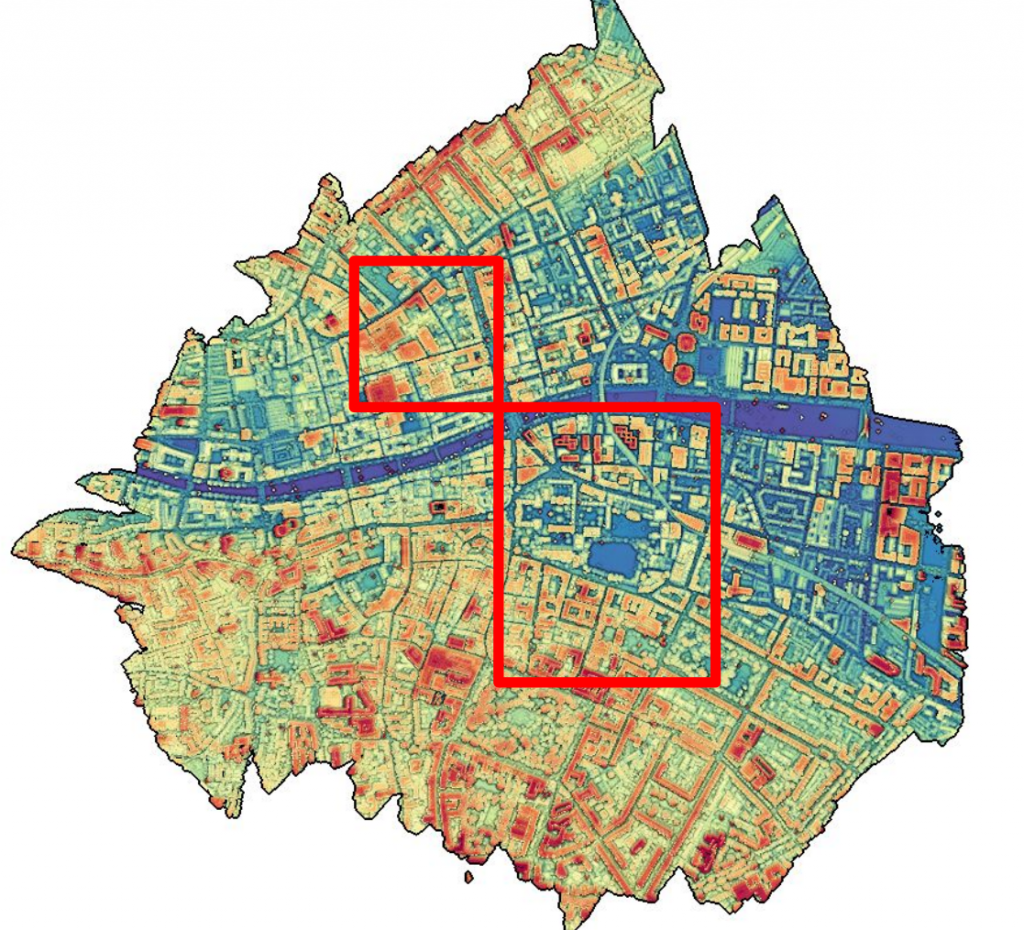
Figure 1. Overview of the data (the most area inside the red boxes are labelled)
Introduction
Urban Modelling Group at University College Dublin (UCD) captured major area of Dublin city centre (i.e. around 5.6 km^2 including partially covered areas) was scanned via an ALS device which was carried out by helicopter in 2015. However, the actual focused area was around 2 km^2 which contains the most densest LiDAR point cloud and imagery dataset. The flight altitude was mostly around 300m and the total journey was performed in 41 flight path strips.
Herein, around 260 million points (out of 1.4 billion) are labelled (figure 1). The selected area is within the most densely sampled part of the point cloud (i.e. 250 to 348 points/m^2) with full coverage by aerial images. This area (i.e. inside the red boxes) includes diverse types of historic and modern urban elements. Types of buildings include offices, shops, libraries, and residential houses. Those buildings are in the form of detached, semi-detached and terraced houses and belong to different eras (e.g. from 17th century rubrics building to the 21st century George’s Quay complex as a modern structure).
The result of the dataset and its applications are accepted and will be published at 30th British Machine Vision Conference (BMVC) on 9th until 12th of September 2019.
If you are using for academic research please cite our paper [2] as well as [1]. For any commercial application, please contact Prof Aljosa Smolic at smolica@scss.tcd.ie.
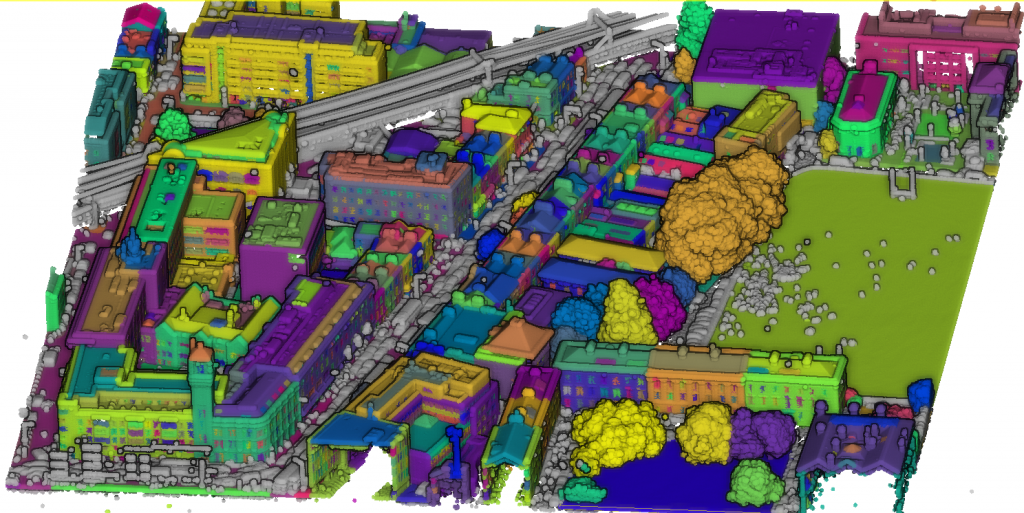
Figure 2. Sample of the labelled Dataset (RGB colour values are not included)
Labelled Dataset:
The labelled dataset is composed by 13 different parts, Figure 3 shows all of them loaded in CloudCompare.
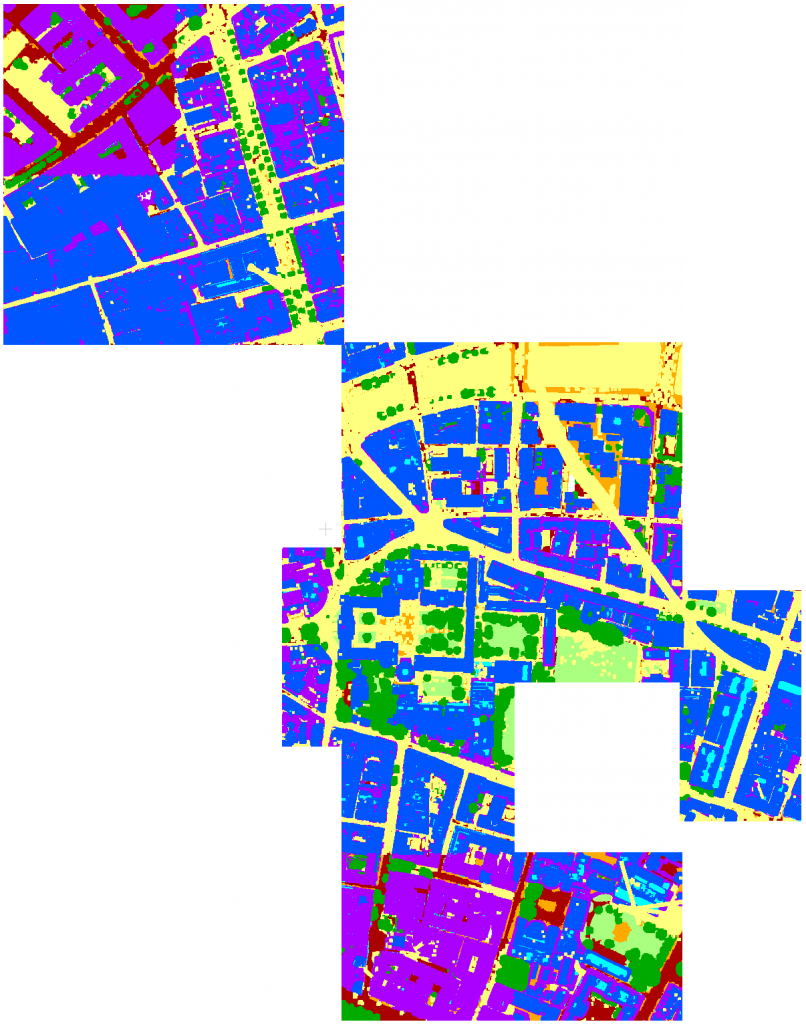
Figure 3. Overview of the annotated dataset loaded in CloudCompare
There are two options to download the dataset:
a. All of the 13 parts can be downloaded all together from the link below:
b. Alternatively, you can download each part separately:
11. T_315500_233500_NE_T_315500_234000_SE.bin
12. T_316000_233500_NE_T_316000_233500_SW.bin
13. T_316500_234000_SW_T_316500_233500_NW.bin
* SW = South West, SE = South East, NW = North West, NE = North East
Hierarchy of Labels
The dataset here is annotated onto 13 classes within 3 levels of detail (Figure 4):
Level 1: This level produces coarse labelling that includes four classes: (a) Building; (b) Ground; (c) Vegetation; and (d) Undefined. Buildings are all shapes of habitable urban structures (e.g. homes, offices, schools and libraries). Ground mostly contains points that are at the terrain elevation. The Vegetation class includes all types of separable plants. Finally, Undefined points are those of less interest to include as urban elements (e.g. bins, decorative sculptures, cars, benches, poles, post boxes and non-static object). Approximately 10% of the total points are labelled as undefined and they are mostly points of river, railways and construction sites.
Level 2: In this level, the first three categories of Level 1 are divided into a series of refined classes. Buildings are labelled into roof and facade. Vegetation is divided into separate plants (e.g. trees and bushes). Finally, Ground points are split into street, sidewalk and grass.
Level 3: Includes any types of doors and windows on roofs (e.g. dormers and skylights) and facades.
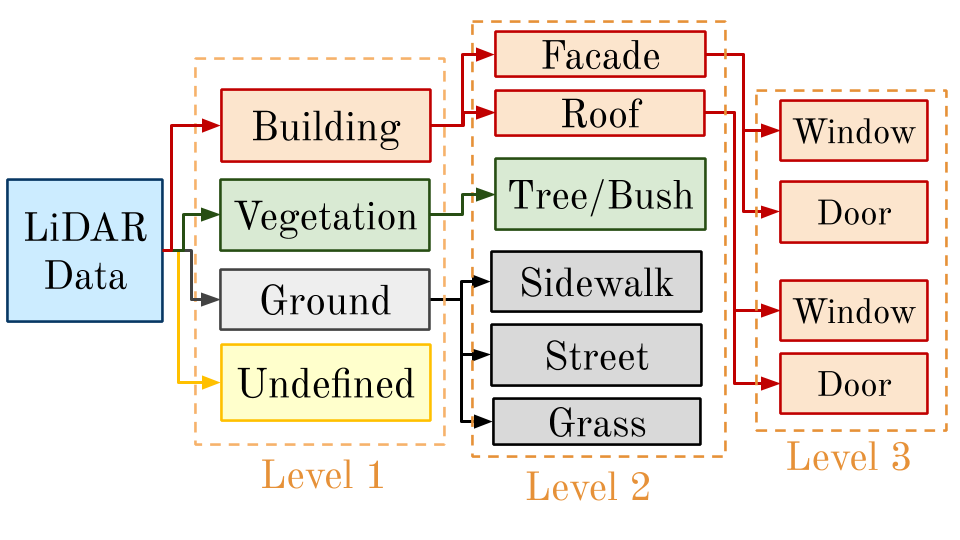
Figure 4. Hierarchy order of labels
The labels order (name of each annotated group of points) are described in Figure 5.
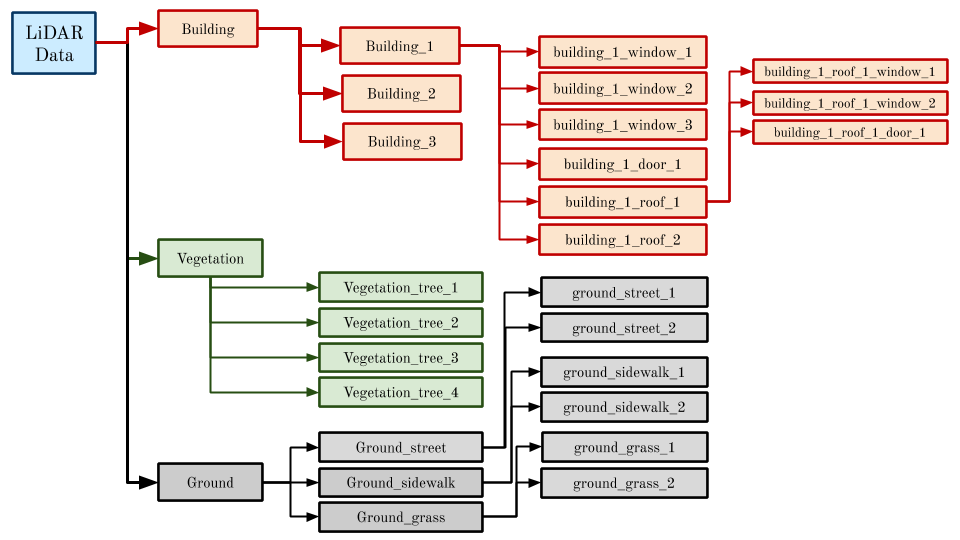
Figure 5. Naming order of labels
How to use the LiDAR Labelled Dataset
To visualise and employing the dataset the latest stable version of CloudCompare (www.cloudcompare.org) can be downloaded and use. You can also export the .bin files to ASCII (.txt, .asc, .xyz or .pts) format. More information about the usage of the CloudCompare (CC) can be found at CC official documentation.
The Original LiDAR Dataset (2015) – Including Aerial Images
The original LiDAR dataset (i.e. raw waveform data and point cloud) are available at NYU data repository [1].
In addition, all of the aerial images (i.e. both oblique and vertical) can be cloned from the repository.
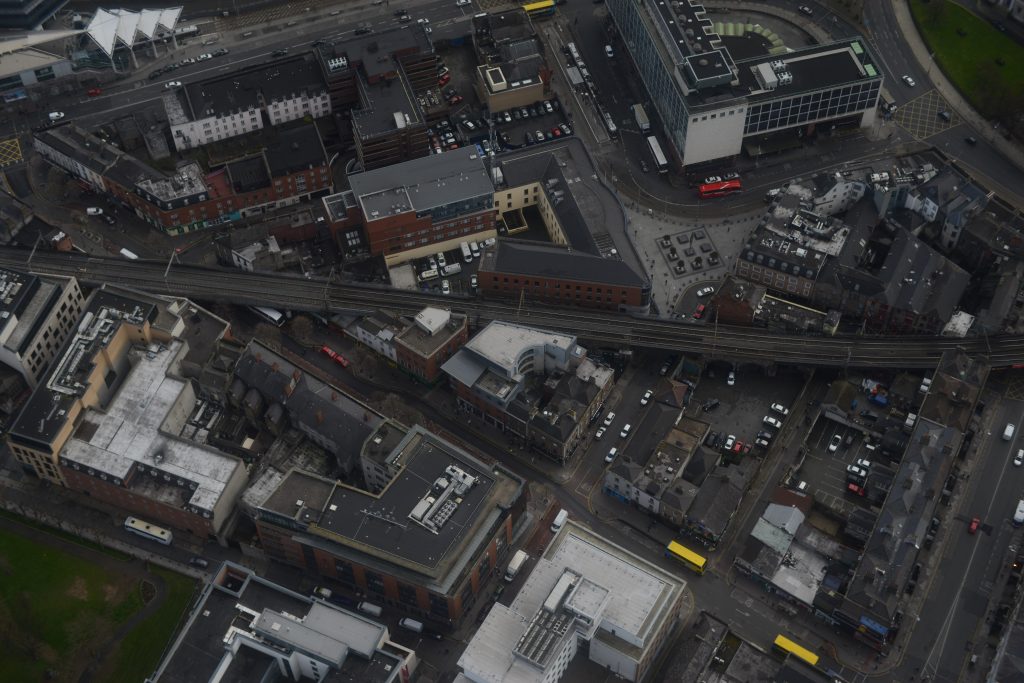
Figure 6. An example of oblique aerial image
Acknowledgement
This publication has emanated from research supported in part by a research grant from Science Foundation Ireland (SFI) under the Grant Number 15/RP/2776 and in part by the European Union’s Horizon 2020 Research and Innovation Programme under Grant Agreement No 780470. The authors highly appreciate the original work of generating LiDAR Point Cloud at Urban Modelling Group in University College Dublin in 2015 (Debra Laefer, et al). In addition, we are grateful for all of the volunteers who generously participated in the process of data labelling, especially Mr S Pouria Vakhshouri Kouhi for his constant support.