


Do Users Behave Similarly in VR? Investigation of the Influence on the System Design
30th August 2019
We are sharing our developed tools and collected user data that we hope will enable in creating more immersive virtual reality experiences. This repository is for open source codes and materials for the paper: Do users behave similarly in VR? Investigation of the influence on the system design
Abstract
With the overarching goal of developing user-centric Virtual Reality (VR) systems, a new wave of studies focused on understanding how users interact in VR environments has recently emerged. Despite the intense efforts, however, current literature still does not provide the right framework to fully interpret and predict users trajectories while navigating in VR scenes. This work advances the state-of-the-art on both the study of users’ behaviour in VR and the user-centric system design. In more details, we complement current datasets by presenting the first publicly available dataset that provides navigation trajectories acquired for heterogeneous omnidirectional videos and different viewing platforms, namely, head-mounted display, tablet and laptop. We then present an exhaustive analysis on the collected data, to better understand navigation in VR across users, content, and for the first time across viewing platforms. The novelty lies in the user-affinity metric, proposed in this work to investigate users’ similarities when navigating within the content. The analysis reveals useful insights on the effect of device and content on the navigation, which could be precious considerations from the system design perspective. As a case study of the importance of studying users’ behaviour when designing VR systems, we finally propose an user-centric server optimisation. We formulate an integer linear program that seeks the best-stored set of omnidirectional content that minimises encoding and storage cost while maximises the user’s experience. This is posed while taking into account network dynamics, type of video content, but also user population interactivity. Experimental results prove that our solution outperforms commonly company recommendations in terms of experienced quality but also in terms of total cost, achieving a saving up to 70%. More importantly, we highlight a strong correlation between the storage cost and the user-affinity metric, showing the impact of the latter in the system architecture design.
Results
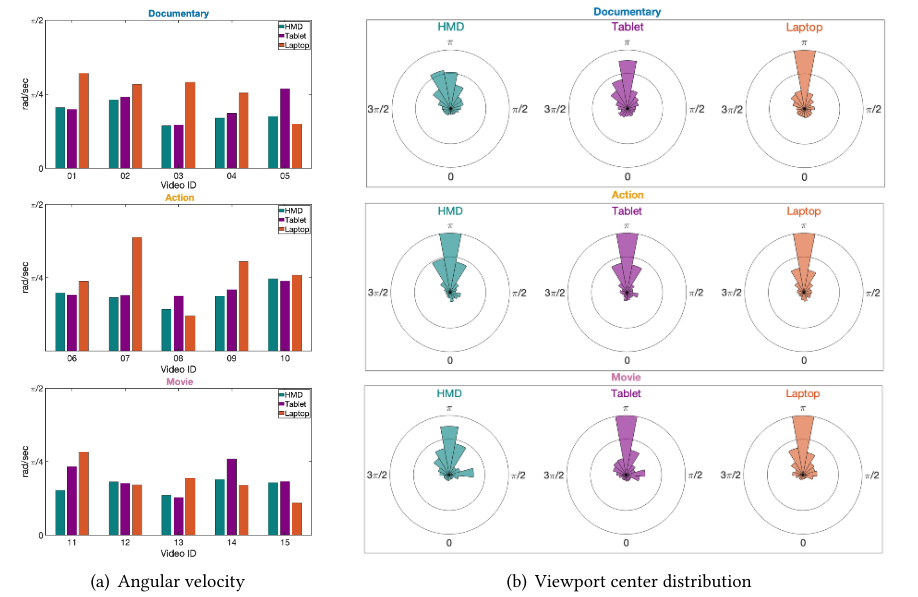
Traditional analysis of users’ behaviour across devices and video categories. (a) Angular velocity per video and device – Video ID refers to Table 1. (b) Viewport center distribution on the longitude direction per video category and device.
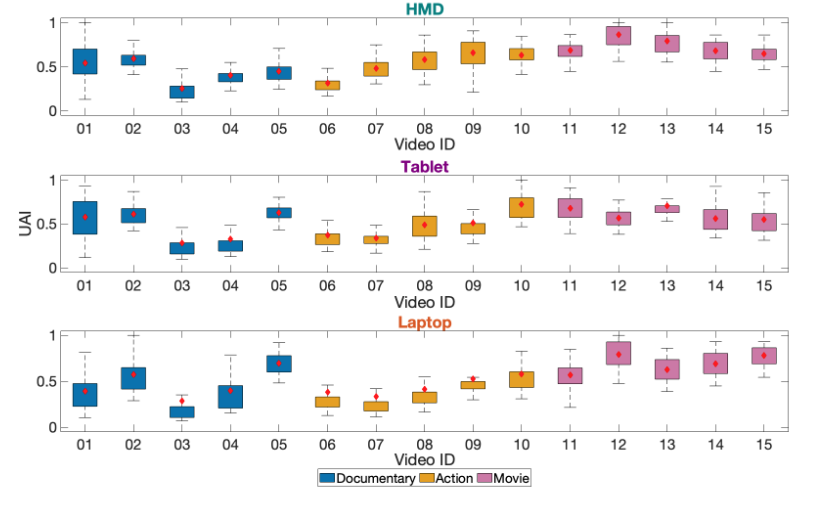 Boxplots per viewing device of Users’ Affinity Index (UAI) for each video in the dataset. The lower and upper side of the rectangular represents 25% and 75% percentile, respectively. While diamond is the mean value of User Affinity Index (UAI) per the entire video.
Citation
Please cite our paper in your publications if it helps your research:
@article{rossi2020,
title = {Do users behave similarly in VR? Investigation of the influence on the system design},
author = {Silvia Rossi and Cagri Ozcinar and Aljosa Smolic and Laura Toni},
year = {2020},
booktitle = {Transactions on Multimedia Computing Communications and Applications}
}
Downloads
Paper (will be available after acceptance)
GitHub
Authors
| Silvia Rossi | Cagri Ozcinar | Aljosa Smolic | Laura Toni |
Acknowledgement
This work has been partially funded by Adobe under Academic Donation scheme. Also, this publication has emanated from research supported in part by a research grant from Science Foundation Ireland (SFI) under the Grant Number 15/RP/2776.